By Kerrine Goh
03 Nov 2011
Measuring the impact of cultural policies
Economics predicts that cultural policies will expand the cultural sector; that support for culture will, in economic terms, increase the quantity of cultural goods and services supplied and demanded (see Modelling the economic impacts of cultural policies).
This expansionary effect might be thought of as a fundamental ‘economic impact’ of cultural policies.
The impact is most obvious in the case of direct provision, where governments provide cultural experiences that would not normally be supplied by the market – for example, a national gallery with free entry.
But most types of intervention promote cultural activity. Grants and subsidies directly fund the production of cultural experiences. Just as farm subsidies boost the agricultural sector by enticing farmers to keep working their land, so cultural subsidies boost the cultural sector by funding activities of creatives and cultural organisations. Indirect interventions – such as tax breaks, philanthropic incentives, market development initiatives, research, leadership or mentoring programs, and audience incentives – also provide an expansionary stimulus to the sector by making cultural activities less risky, more viable, or more sustainable.
So, whether or not it is their main aim, cultural policies tend to expand the cultural sector. And logically, the greater the government intervention, the greater the expansion expected.
This expansionary economic impact can be measured and tested. All we need is two statistical indicators: one measuring the level of government support for culture; the other measuring the size of the cultural sector.
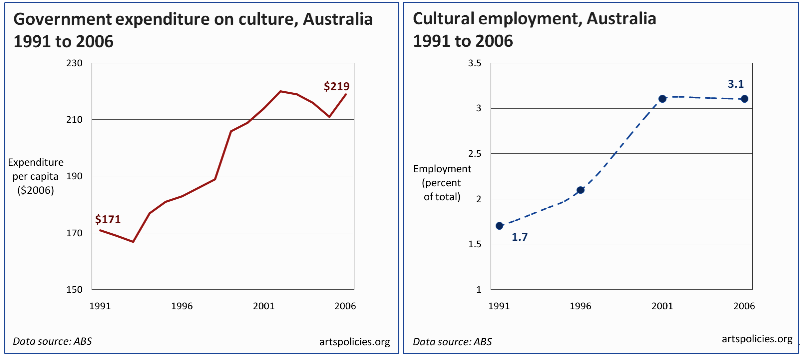
The figures below show two such indicators for Australia for the period 1991 to 2006. Government support for culture is measured by government expenditure on culture. Sector size is measured by employment in cultural occupations. (More detail on these indicators at the bottom of this page)
The two measures follow broadly similar paths over the period. Rising from 1991, and particularly steeply between 1996 and 2001, the lines level off from 2001 to 2006. Their similarity is illustrated more dramatically in the figure below, which superimposes the two series on the same graph.
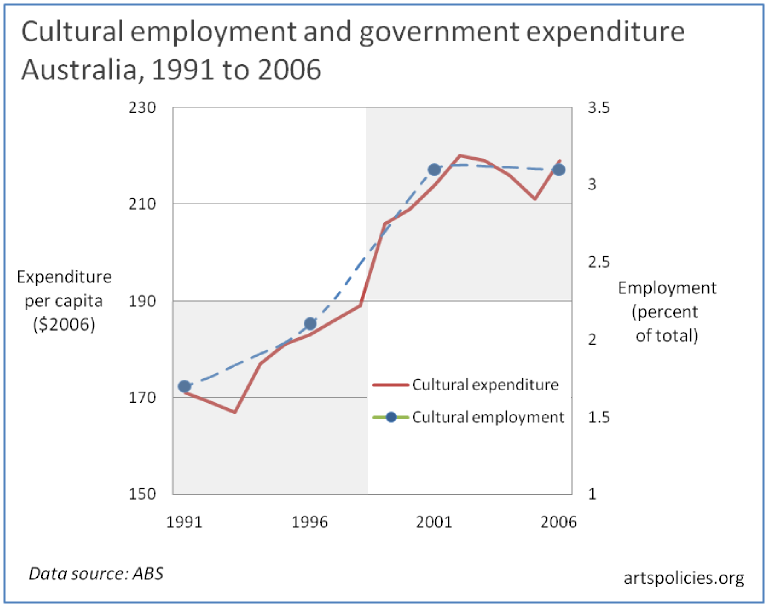
[caption id="attachment_16418" align="aligncenter" width="482" caption="Cultural employment and government expenditure, Australia 1991 to 2006"]
 [/caption]
If such a close correlation seems too good to be true, consider the data at its most basic level. There are two distinct time periods, shown as shaded areas on the figure: the first, when both cultural expenditure and cultural employment are lower; the second when both cultural expenditure and cultural employment are higher.
At this simple level of interpretation, the indicators could be seen as moving in concert over the period. Such closeness is repeated in data from New Zealand, as shown in the figure below.
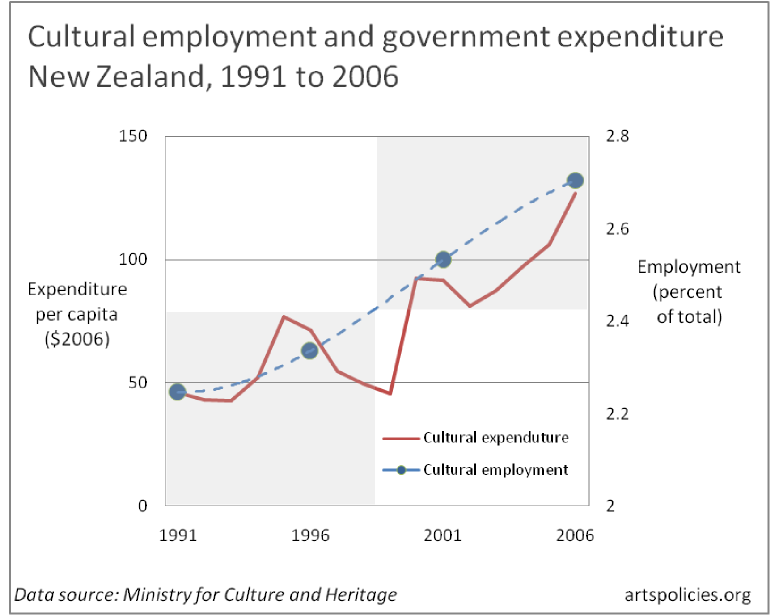
[caption id="attachment_16421" align="aligncenter" width="485" caption="Cultural employment and government expenditure, New Zealand 1991 to 2006"]
 [/caption]
New Zealand’s government expenditure series is a little more volatile than Australia’s. But again, standing back and looking at the broader landscape, the two New Zealand series also track in a strikingly similar way across the period. (For the record, between 1991 and 2006 government cultural expenditure rises from $46 to $127 per capita; employment in cultural occupations from 2.2 to 2.7 percent of total employment)
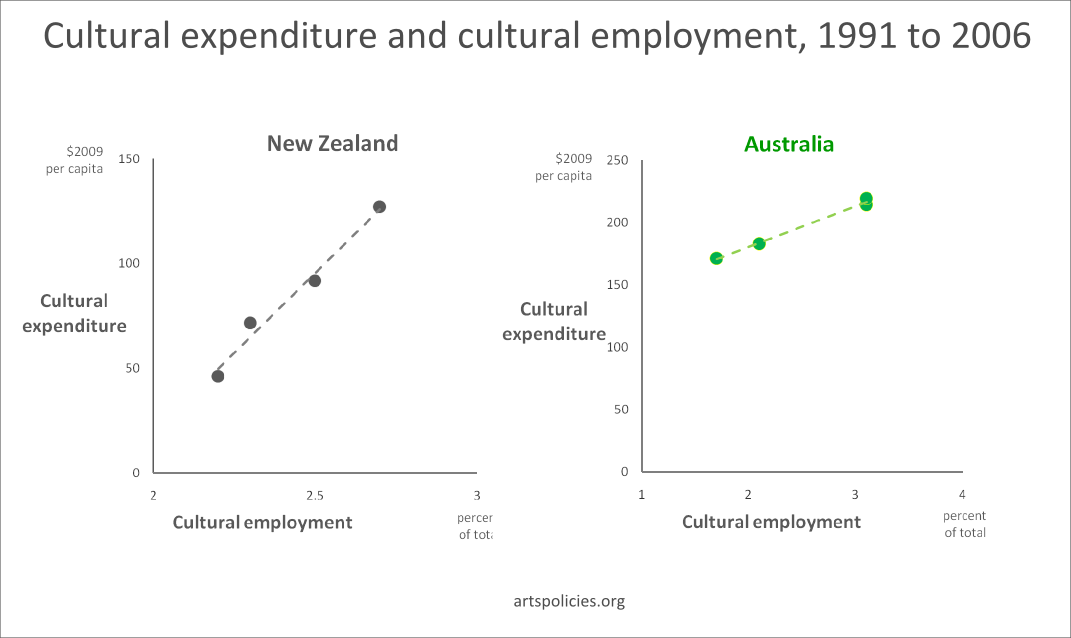
There is another way to view the data that reveals more clearly the close relationship between the two series. In the figures below, cultural employment is plotted against government cultural expenditure for each country at each census year (1991, 1996, 2001 and 2006). Lines are added to provide a visual reference.
[caption id="attachment_16423" align="aligncenter" width="554" caption="Cultural expenditure and cultural employment 1991 to 2006"]
 [/caption]
These figures show the strong correlation between the two measures: lower values of government expenditure are associated with lower levels of cultural employment; higher values of government expenditure with higher levels of cultural employment. The strength of the relationship is revealed by how close the data points are to the line. (Data points a long way away from the line would imply a weaker relationship)
By now it should be evident that the relationship between the two series is remarkably strong. The numbers tell a clear story: For both countries, increases in cultural expenditure have coincided with expanding cultural sectors.
What does this mean? Taken at face value, it seems that cultural policies in Australia and New Zealand have lead to expansions in those countries’ cultural sectors. In this sense, the policies might be hailed as successes. Before drawing this conclusion, however, it is worth considering three important limitations in the data.
First, the data show correlations, not causation. They show that higher levels of cultural expenditure have been associated with higher levels of cultural employment in the two countries, not that increases in cultural expenditure have actually caused increases in cultural employment. This is a common data problem for policymakers, who are usually unable to perform the sorts of double-blind clinical trials used in medical research to measure cause and effect. The best way to infer causality in policy is through sound argument and robust theory. Economics, as described earlier, provides good reasons to argue that the increases in cultural expenditure seen in Australia and New Zealand did indeed play some part in expanding the countries’ cultural sectors.
Second, the data show quantities only. They say nothing about quality, about whether one time period is better than the other, or whether cultural expansion brought improved cultural experiences. The data here only tell us that the expansion occurred, not whether it was a good thing, or whether the gains from expansion outweighed any losses.
Finally, although the relationship is strong for the period under consideration, this does not mean that it will hold in the future. The data cannot predict that further increases in government cultural expenditure will stimulate further expansions in the cultural sector. New data for both countries will be available from censuses undertaken this year. It will be interesting to see if the relationship uncovered here still holds for 2011.
Even with these caveats in mind, the data do reveal a remarkably strong relationship between government cultural expenditure and cultural employment. In both Australia and New Zealand, increases in government expenditure between 1991 and 2006 have gone hand-in-hand with increases in cultural employment. With the support of economic modelling, it is hard not to interpret the growth in employment as driven, if only in part, by government policy.
And, though the data are no proof that the countries are culturally better off, they do point to cultural policies as having at least a quantitative impact. Rising cultural expenditures in Australia and New Zealand have, at the very least, gained ‘traction’. By this measure, then, Australasia’s cultural policies appear to have enjoyed a degree of success.
Christopher Madden is a cultural policy research analyst and statistician. He has worked for a range of cultural policy agencies across Australasia. From 2001 to 2008 he was Research Analyst at the International Federation of Arts Councils and Culture Agencies. Christopher’s research can be viewed at his website artspolicies.org.
Note on the statistical indicators
Government expenditure on culture
Indicator: real government expenditure on culture per capita
This annual data comes from government accounts compiled by the Australian Bureau of Statistics (ABS) in Australia and the Ministry for Culture and Heritage in New Zealand. Expenditure includes both recurrent and capital and is expressed in per capita to take account of growth in the size of each country. The effects of inflation have been removed (each are ‘real’ series expressed in 2009 dollars). Australian data include national and state government cultural expenditures, but not local government. New Zealand data include national government expenditure but not local government or Lottery Grants Board funding. Indicators for both countries include recurrent and capital expenditure.
The author is grateful to the Ministry for Culture and Heritage for providing unpublished data on government cultural expenditure in New Zealand.
Cultural sector size
Indicator: employment in cultural occupations as a percent of total employment
This data comes from each country’s Census. Data are only available as five-yearly ‘snapshots’, seen on the figures as the data points. Lines are added to provide a rough visual reference only. Employment in cultural occupations is expressed as a percentage of total employment to take account of economic growth and business cycles such as booms and recessions.
Similar content
posted on
28 Jul 2011

posted on
28 Jul 2011
posted on
09 Apr 2015
posted on
04 Aug 2017

posted on
11 Mar 2013

posted on
08 Sep 2010